Racial Demographics at UIUC
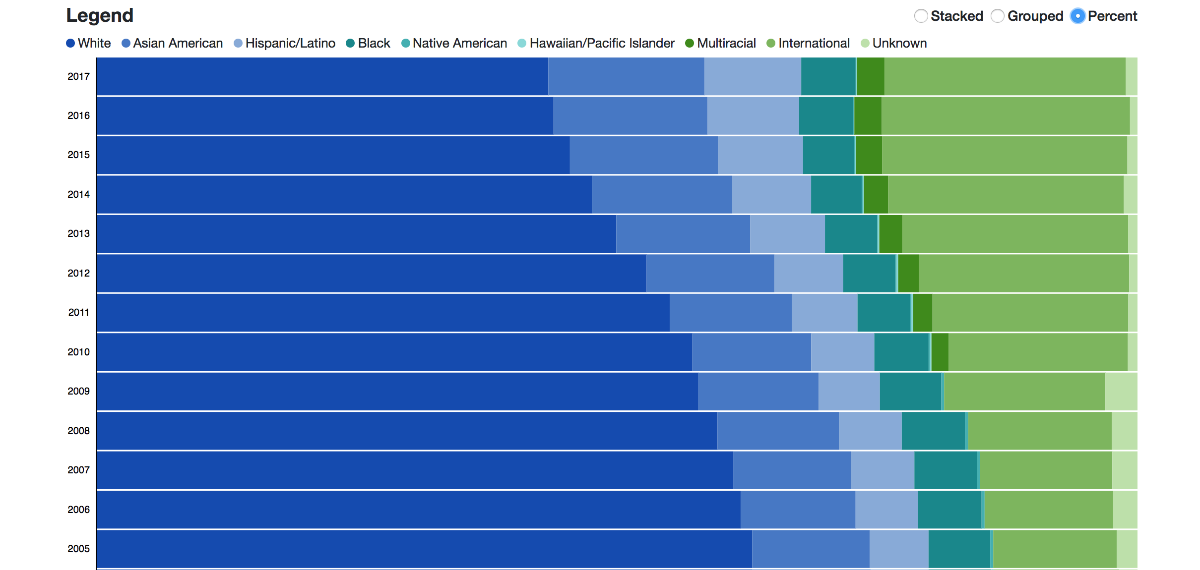
The first known interactive visualization displaying 50 years of racial demographics at Illinois.

Visualization Overview
The University of Illinois has been collecting self-reported racial demographic data regarding its students for over 50 years. This visualization explores a series of reports provided by the Division of Management Information's Student Enrollment Survey from 1968-2017.
Evolution of Racial Demographics at UIUC
As race is a social construct, the ways that people are able to identify have evolved through the years. The Student Enrollment Survey looks at race from an American context and reports students from outside of the country as International. It was not until 2010 that the University offered Hawaiian/Pacific Islander or Multiracial as options for this data. With these circumstances considered, we can observe how U of I students have racially identified within the last 50 years and examine the evolution of our student population.
Interact with this Visualization
Tap or click on any bar to focus on a single race. The graph will reorganize itself to reveal the trends about a selected race over the 50 year period.


 Gender Diversity at UIUC
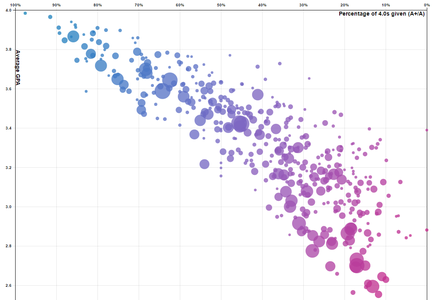
 Every Gen Ed at UIUC, by GPA
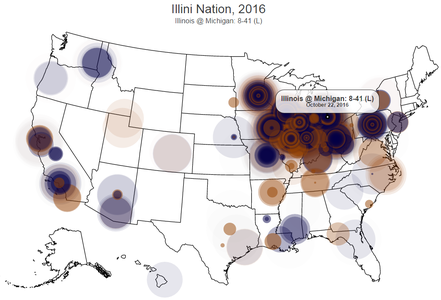
 Illini Nation through 120+ Years of Illini Football