It is common for you to find articles everywhere that use probabilistic words to describe events. Just a few examples I found in a quick internet search:
"'Highly unlikely' State of the Union will happen amid shutdown" – The Hill
"Tiger Woods makes Masters 15th and most improbable major" – Fox Business
"Trump predicts 'very good chance' of China trade deal" – CNN
A study in the 1960s explored the perception of probabilistic words like these among NATO officers. Curious on how this differs today, I asked my connections on social media to take a survey of their perception of the same probabilistic words studied by the NATO. Among the 123 people who responded, a simple visualization to show their perception.
In general, the perceptions that we hold of probabilistic words has changed very little since the studies in the 1950s. The first trend that is very clear when viewing individual responses in aggregate is that nearly everyone tends to choose probabilities that end in a 0 or a 5, like 20% or 85%. Among all 2,091 responses, 1,795 (85.8%) of the responses end in a 0 or 5 — we could say there is a very good chance your response will end in a 0 or 5.
A second clear trend is some probabilistic words have a narrower range of perception than other words. The box plot visualization shows a shaded box that includes the range of responses that encompass the middle-50% of responses. This middle 50% is known as the Interquartile Range or IQR. For example:
The following table ranks every word by the width of the IQR:
| Probability Word | IQR Middle 50% |
|---|---|
| About Even | 0.0% 50.0% - 50.0% |
| Almost No Chance | 4.0% 1.0% - 5.0% |
| Better than Even | 5.0% 55.0% - 60.0% |
| Highly Unlikely | 5.0% 5.0% - 10.0% |
| Almost Certain | 8.0% 90.0% - 98.0% |
| Likely | 10.0% 65.0% - 75.0% |
| Chances are Slight | 10.0% 10.0% - 20.0% |
| Little Chance | 10.0% 5.0% - 15.0% |
| Highly Likely | 15.0% 80.0% - 95.0% |
| Probable | 15.0% 60.0% - 75.0% |
| Very Good Chance | 15.0% 75.0% - 90.0% |
| Probably Not | 15.0% 15.0% - 30.0% |
| Probably | 15.0% 60.0% - 75.0% |
| Improbable | 17.5% 5.0% - 22.5% |
| We Believe | 20.0% 65.0% - 85.0% |
| We Doubt | 20.0% 10.0% - 30.0% |
| Unlikely | 20.0% 10.0% - 30.0% |
The first widely published work to begin to analyze the perception of probabilistic words was written by Sherman Kent while he was working for the CIA. Originally a classified work, "Words of Estimative Probability" was published in Studies in Intelligence in 1964. In this work, Kent outlined several key terms with a probability and a range and proposed the scale to be used by the CIA:
|
Kent's Work (1964)
Proposed scale for CIA officers
|
This Survey (2019)
Internet survey of primarily undergraduate students
|
||
|---|---|---|---|
|
Word
Words with the same "linguistic expression"
|
Probability Proposed Range |
Word | Median Middle 50% |
| Certain | 100.0% 100.0% - 100.0% |
— | |
|
Almost Certain
Virtually Certain
All but Certain Highly Probable Highly Likely Odds Overwhelming | 93.0% 87.0% - 99.0% |
Almost Certain | 95.0% 90.0% - 98.0% |
| Highly Likely | 90.0% 80.0% - 95.0% | ||
|
Probable
Conceivable
Could May Might Perhaps | 75.0% 63.0% - 87.0% |
Very Good Chance | 80.0% 75.0% - 90.0% |
| We Believe | 75.0% 65.0% - 85.0% | ||
| Probably | 70.0% 60.0% - 75.0% | ||
| Probable | 70.0% 60.0% - 75.0% | ||
| Likely | 70.0% 65.0% - 75.0% | ||
|
Chances About Even
Chances about Even
Chances a Little Better than Even Chances a Little Worse than Even Improbable Unlikely | 50.0% 40.0% - 60.0% |
Better than Even | 60.0% 55.0% - 60.0% |
| About Even | 50.0% 50.0% - 50.0% | ||
|
Probably Not
We Believe that Not
We Estimate that Not We Doubt Doubtful | 30.0% 20.0% - 40.0% |
Probably Not | 25.0% 15.0% - 30.0% |
| We Doubt | 20.0% 10.0% - 30.0% | ||
| Unlikely | 20.0% 10.0% - 30.0% | ||
|
Almost Certainly Not
Virtually Impossible
Almost Impossible Some Slight Chance Highly Doubtful | 7.0% 2.0% - 12.0% |
Little Chance | 10.0% 5.0% - 15.0% |
| Chances are Slight | 10.0% 10.0% - 20.0% | ||
| Improbable | 10.0% 5.0% - 22.5% | ||
| Highly Unlikely | 5.0% 5.0% - 10.0% | ||
| Almost No Chance | 2.0% 1.0% - 5.0% | ||
| Impossible | 0.0% 0.0% - 0.0% |
— | |
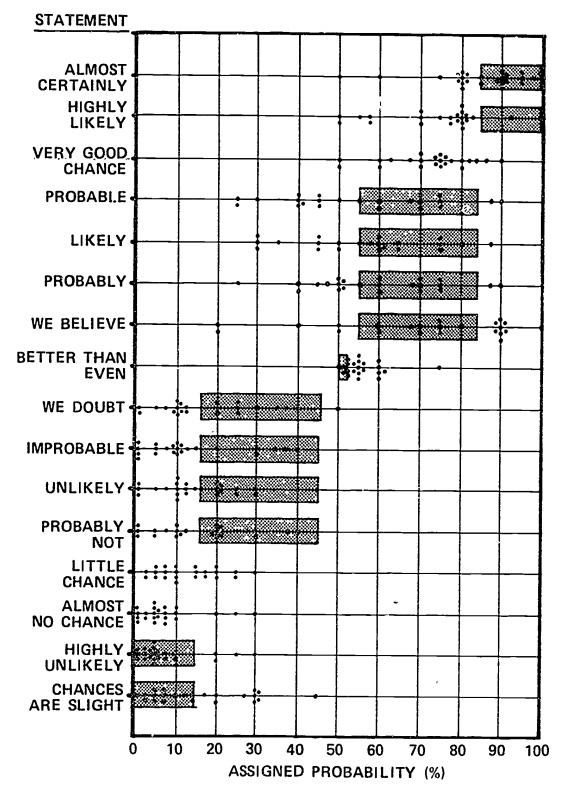
Over a decade later, Scott Barclay et. al., working for the Advanced Research Projects Agency published a 285 page book entitled "Handbook for Decisions Analysis" for the Department of Defence. This work references Kent's work and a NATO study where "twenty-three [NATO] officers, ranking from squadron leader to lieutenant general" were asked about many probabilistic words. Specifically:
Several different sentences were constructed in the following manner. "It is highly likely that the Soviets will invade Czechoslovakia," or "It is almost certain that the Soviets will invade Czechoslovakia," or "We believe that the Soviets will invade Czechoslovakia." The basic structure of all sentences remained constant; only the-verbal qualifiers changed.
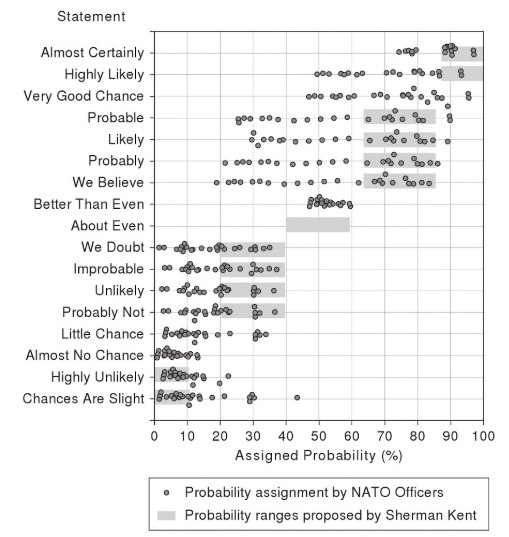
The results of this survey of NATO officers produced the first visualization that combined Kent's work and a human survey that is still widely available today. In presentation the visualization, Barclay comments: "Clearly, the readers in this experiment were not using the Sherman Kent scale even though they were familiar with it." Barclay's visualization was later recreated by others with modern typeset:
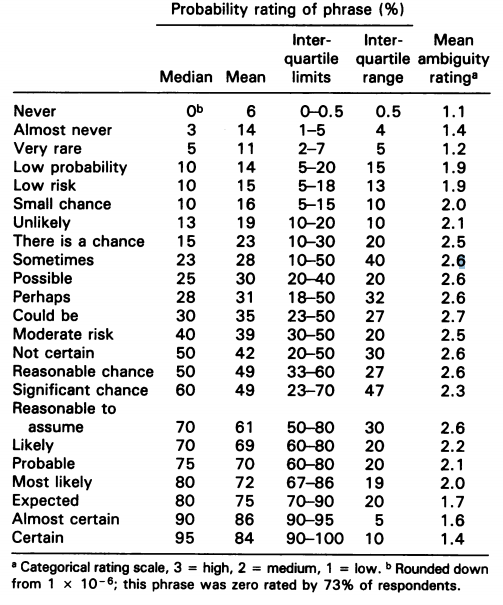
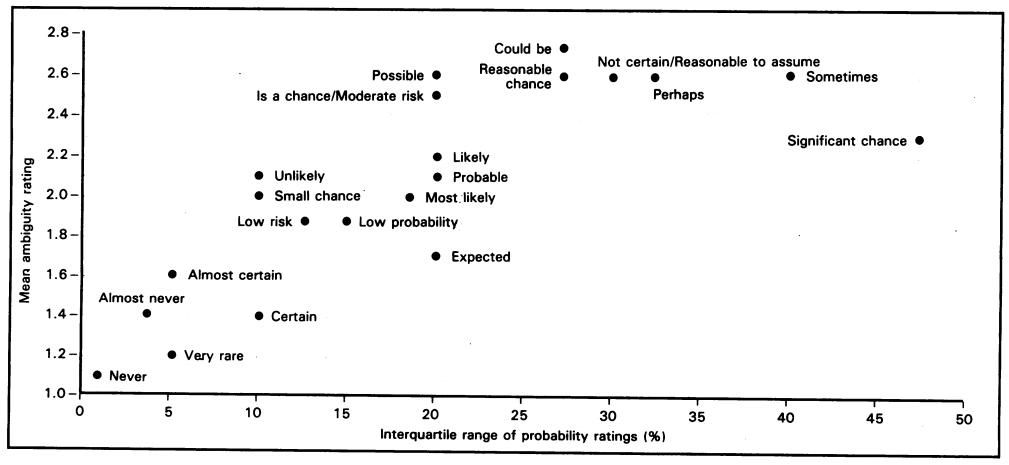
The work of assigning specific probabilities to probabilistic words has also been studied in other fields with uncertainty including metrology and medicine. For example, Bernie J. O'Brien's 1989 paper "Words or numbers? The evaluation of probability expressions in general practice" surveyed "communicating to patients the probability of a side-effect (headache) arising from an unspecified prescription medicine." O'brien's worked surveyed 52 general practitioners and used Spearman's rank correlation coefficient to determine a "ambiguity ranking" for each word and used a scatter plot to rank IQR range vs. ambiguity:
This work was popularized online in 2015 when reddit.com user /u/zonination performed an internet survey similar to the survey done for this work. In zonination's survey, 48 users responded and uploaded the data, alongside a visualization made in R, to github and shared it on reddit. zonination's post won the 2015 Kantar Information is Beautiful Award and lead numerous articles across various websites and blogs:
The area of human perception of probabilistic words continues to be an area of somewhat active research, with peer-reviewed academic papers published as recently as last year.
Complete Data Set (CSV): https://github.com/wadefagen/datasets/tree/master/Perception-of-Probability-Words
A previous version of this page listed an incorrect publication date for “Handbook for Decisions Analysis” and has been corrected. Thanks to Dr. Charles Twardy for the correction.