Grade disparity between sections at UIUC
Updated for Spring 2024 Registration on April 05, 2024 by Wade Fagen-Ulmschneider
Introduction
One of the most frustrating situations to find yourself in is a coursewhere all of your friends are in the "easier section". For most of us, it feels like this happens all of the time. This visualization is the second in a series of GPA visualizations created to explore the grades given by courses at The University of Illinois.
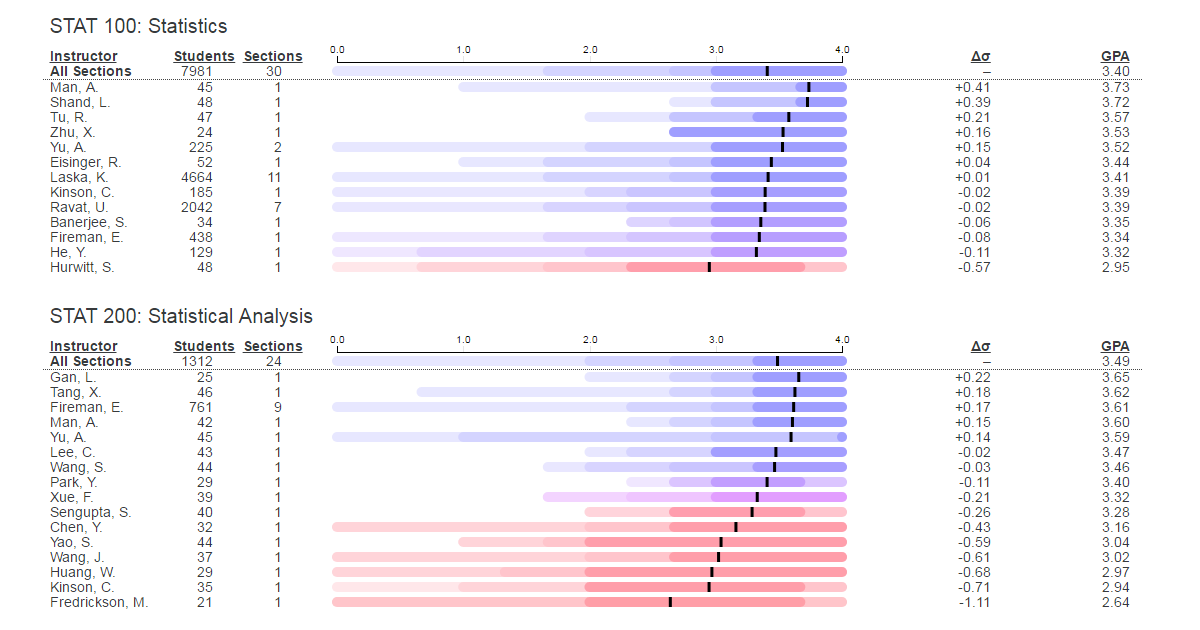
Using GPA data from the most recent eight full semesters (Spring 2019 through Fall 2023, including summers/winters), we found the distribution of every section/instructor group within every course. For example, Calculus I (MATH 221) has been taught by seven different primary instructors recently. We found the following distributions:
50%-tile
12.5%-tile
7.5%-tile
(95%/5%)
External Impact
In the preparation of this work, we found other factors — including the time of day of the lecture and if the course was in-person or online — also have a major contribution to the final grades in a course. We hope others will dive deeper into these factors in the future.
Find Your Course
Type the subject for any course at UIUC (eg: CS for Computer Science) to find the disparity of grades between different sections of a course: